Modern Portfolio TheoryAs of 31-May-2026 (MPT)
Statistics
3-Year Trailing
R-Squared
Beta
Alpha
Treynor Ratio
vs. Best-Fit Index
XLE
99.76
1.00
-0.18
n/a
vs. Standard Index
XLE
0.00
0.00
13.36
-3,537.21
Category: Equity Energy
8.28
0.32
9.46
-138.96
5-Year Trailing
R-Squared
Beta
Alpha
Treynor Ratio
vs. Best-Fit Index
XLE
n/a
n/a
n/a
n/a
vs. Standard Index
XLE
5.87
0.42
15.23
41.07
Category: Equity Energy
14.97
0.62
10.66
27.18
10-Year Trailing
R-Squared
Beta
Alpha
Treynor Ratio
vs. Best-Fit Index
XLE
n/a
n/a
n/a
n/a
vs. Standard Index
XLE
29.36
1.10
-0.50
6.64
Category: Equity Energy
34.21
1.28
-4.33
3.81
15-Year Trailing
R-Squared
Beta
Alpha
Treynor Ratio
vs. Best-Fit Index
XLE
n/a
n/a
n/a
n/a
vs. Standard Index
XLE
36.30
1.14
-2.43
3.95
Category: Equity Energy
38.56
1.35
-7.30
0.46
Volatility Measures As of 31-May-2026
3-Year Trailing
Standard Deviation
Sharpe Ratio
Sortino Ratio
XLE
19.20
0.69
1.14
Category: Equity Energy
20.70
0.75
1.35
5-Year Trailing
Standard Deviation
Sharpe Ratio
Sortino Ratio
XLE
25.81
0.72
1.28
Category: Equity Energy
26.57
0.61
1.04
10-Year Trailing
Standard Deviation
Sharpe Ratio
Sortino Ratio
XLE
29.76
0.38
0.60
Category: Equity Energy
32.56
0.31
0.47
15-Year Trailing
Standard Deviation
Sharpe Ratio
Sortino Ratio
XLE
27.01
0.30
0.46
Category: Equity Energy
31.36
0.18
0.27
Tax Considerations As of 31-May-2026
Tax Cost Ratio
1.28
Annual Turnover Ratio
10.00%
Potential Cap Gains Exposure
-39.03%
Dividend Paid in Past 12 Months
2.23%
Distribution Frequency
Quarterly
Number of Holdings
21
Ex-Date
23-Mar-2026
Pay Date
25-Mar-2026
Last Dividend Rate
$0.39
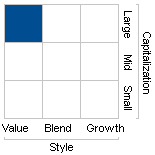
Morningstar Style Map As of 31-May-2026
Equity View
= Current
3-Year
3Star Rating
out
of 67 funds
5-Year
3Star Rating
out
of 62 funds
10-Year
4 Star Rating
out
of 57 funds
Overall
4 Star Rating
Morningstar Category
Equity Energy
Prospectus Primary Benchmark
S&P 500 (TR) (1970)
Fund Data As of 15-Jun-2026
Shares Outstanding
680 M
Market Cap
$38 B
Market Cap % Chg Last Month
-9%
Risk
Exchange traded products (ETPs) are subject to market volatility and the risks of their underlying securities which may include the risks associated with investing in smaller companies, foreign securities, commodities and fixed income investments. Foreign securities are subject to interest-rate, currency-exchange-rate, economic, and political risks, all of which are magnified in emerging markets. ETPs that target a small universe of securities, such as a specific region or market sector are generally subject to greater market volatility as well as the specific risks associated with that sector, region or other focus. ETPs which use derivatives, leverage, or complex investment strategies are subject to additional risks. The return of an index ETP is usually different from that of the index it tracks because of fees, expenses and tracking error. An ETP may trade at a premium or discount to its Net Asset Value (NAV) (or Indicative Value in the case of ETNs). Each ETP has a unique risk profile which is detailed in its prospectus, offering circular or similar material, which should be considered carefully when making investment decisions.
You are about to leave this website for an unaffiliated, third-party website. Fidelity has not been
involved in the creation of the content supplied at the unaffiliated site and does not guarantee or
assume any responsibility for its content or technology
 -0.19 (-0.34%)
 = Current


